Visualizing 1D categorical data
species island bill_len bill_dep flipper_len body_mass sex year
1 Adelie Torgersen 39.1 18.7 181 3750 male 2007
2 Adelie Torgersen 39.5 17.4 186 3800 female 2007
3 Adelie Torgersen 40.3 18.0 195 3250 female 2007
4 Adelie Torgersen NA NA NA NA <NA> 2007
5 Adelie Torgersen 36.7 19.3 193 3450 female 2007
6 Adelie Torgersen 39.3 20.6 190 3650 male 2007
Data wrangling with dplyr
dplyr is a package within the tidyverse with functions for data wrangling
select()
|> select (species, island, body_mass)
# A tibble: 344 × 3
species island body_mass
<fct> <fct> <int>
1 Adelie Torgersen 3750
2 Adelie Torgersen 3800
3 Adelie Torgersen 3250
4 Adelie Torgersen NA
5 Adelie Torgersen 3450
6 Adelie Torgersen 3650
7 Adelie Torgersen 3625
8 Adelie Torgersen 4675
9 Adelie Torgersen 3475
10 Adelie Torgersen 4250
# ℹ 334 more rows
filter()
Use filter() to extract ROWS (observations) that meet certain conditions
Need to specify a logical condition (aka boolean expression)
x < y: less thanx <= y: less than or equal tox == y: equal tox != y: not equal tox > y: greater thanx >= y: greater than or equal to
x %in% y: whether the value is present in a given vectoris.na(x): is missing!is.na(x): is not missingx & y: andx | y: or!x: not
filter()Example: Extract features for female Adelie penguins only
|> filter (species == "Adelie" & sex == "female" )
# A tibble: 73 × 8
species island bill_len bill_dep flipper_len body_mass sex year
<fct> <fct> <dbl> <dbl> <int> <int> <fct> <int>
1 Adelie Torgersen 39.5 17.4 186 3800 female 2007
2 Adelie Torgersen 40.3 18 195 3250 female 2007
3 Adelie Torgersen 36.7 19.3 193 3450 female 2007
4 Adelie Torgersen 38.9 17.8 181 3625 female 2007
5 Adelie Torgersen 41.1 17.6 182 3200 female 2007
6 Adelie Torgersen 36.6 17.8 185 3700 female 2007
7 Adelie Torgersen 38.7 19 195 3450 female 2007
8 Adelie Torgersen 34.4 18.4 184 3325 female 2007
9 Adelie Biscoe 37.8 18.3 174 3400 female 2007
10 Adelie Biscoe 35.9 19.2 189 3800 female 2007
# ℹ 63 more rows
arrange()
Example: Sort penguins by body mass (heaviest first)
|> arrange (desc (body_mass)) # desc() for descending order
# A tibble: 344 × 8
species island bill_len bill_dep flipper_len body_mass sex year
<fct> <fct> <dbl> <dbl> <int> <int> <fct> <int>
1 Gentoo Biscoe 49.2 15.2 221 6300 male 2007
2 Gentoo Biscoe 59.6 17 230 6050 male 2007
3 Gentoo Biscoe 51.1 16.3 220 6000 male 2008
4 Gentoo Biscoe 48.8 16.2 222 6000 male 2009
5 Gentoo Biscoe 45.2 16.4 223 5950 male 2008
6 Gentoo Biscoe 49.8 15.9 229 5950 male 2009
7 Gentoo Biscoe 48.4 14.6 213 5850 male 2007
8 Gentoo Biscoe 49.3 15.7 217 5850 male 2007
9 Gentoo Biscoe 55.1 16 230 5850 male 2009
10 Gentoo Biscoe 49.5 16.2 229 5800 male 2008
# ℹ 334 more rows
arrange()
Arrange by multiple columns (variable order matters)
Example: Sort penguins by bill length (low to high, first sort), then flipper length (high to low, second sort)
|> arrange (bill_len, desc (flipper_len))
# A tibble: 344 × 8
species island bill_len bill_dep flipper_len body_mass sex year
<fct> <fct> <dbl> <dbl> <int> <int> <fct> <int>
1 Adelie Dream 32.1 15.5 188 3050 female 2009
2 Adelie Dream 33.1 16.1 178 2900 female 2008
3 Adelie Torgersen 33.5 19 190 3600 female 2008
4 Adelie Dream 34 17.1 185 3400 female 2008
5 Adelie Torgersen 34.1 18.1 193 3475 <NA> 2007
6 Adelie Torgersen 34.4 18.4 184 3325 female 2007
7 Adelie Biscoe 34.5 18.1 187 2900 female 2008
8 Adelie Torgersen 34.6 21.1 198 4400 male 2007
9 Adelie Torgersen 34.6 17.2 189 3200 female 2008
10 Adelie Biscoe 35 17.9 192 3725 female 2009
# ℹ 334 more rows
mutate()Example: Create a new column for bill ratio (bill length / bill depth), and a new column to categorize penguins as “large” if they weigh more than 4.5kg
|> mutate (bill_ratio = bill_len / bill_dep,is_large = ifelse (body_mass > 4500 , 1 , 0 ))
# A tibble: 344 × 10
species island bill_len bill_dep flipper_len body_mass sex year bill_ratio
<fct> <fct> <dbl> <dbl> <int> <int> <fct> <int> <dbl>
1 Adelie Torge… 39.1 18.7 181 3750 male 2007 2.09
2 Adelie Torge… 39.5 17.4 186 3800 fema… 2007 2.27
3 Adelie Torge… 40.3 18 195 3250 fema… 2007 2.24
4 Adelie Torge… NA NA NA NA <NA> 2007 NA
5 Adelie Torge… 36.7 19.3 193 3450 fema… 2007 1.90
6 Adelie Torge… 39.3 20.6 190 3650 male 2007 1.91
7 Adelie Torge… 38.9 17.8 181 3625 fema… 2007 2.19
8 Adelie Torge… 39.2 19.6 195 4675 male 2007 2
9 Adelie Torge… 34.1 18.1 193 3475 <NA> 2007 1.88
10 Adelie Torge… 42 20.2 190 4250 <NA> 2007 2.08
# ℹ 334 more rows
# ℹ 1 more variable: is_large <dbl>
summarize() (by itself)
Use summarize() to collapse the data down to a single row (per group)
Useful for computing summaries (e.g., mean, median, max, min, correlation, etc.)
|> summarize (median_bill_len = median (bill_len, na.rm = TRUE ))
# A tibble: 1 × 1
median_bill_len
<dbl>
1 44.4
group_by() and summarize()
group_by() converts the data into a grouped format where operations are performed by group
A group can be defined by one or more variables (columns)
group_by() becomes powerful when combining with summarize()
Use the pipe operator |> to perform multiple operations
Example: How many male and female Adelie penguins are in each island (Biscoe, Dream, Torgersen)?
|> filter (species == "Adelie" , ! is.na (sex)) |> group_by (sex, island) |> summarize (count = n ())
# A tibble: 6 × 3
# Groups: sex [2]
sex island count
<fct> <fct> <int>
1 female Biscoe 22
2 female Dream 27
3 female Torgersen 24
4 male Biscoe 22
5 male Dream 28
6 male Torgersen 23
Variable types
Most visualizations are about understanding the distribution of different variables (columns)
The variable type usually dictates the type of graphs you should make
There are two main types of variables:
Quantitative
Discrete (i.e., counts, usually recorded as whole numbers)
Continuous (any real number)
Categorical
Categorical data
Two different versions of categorical data:
Nominal : categorical variables having unordered scales
Examples: race, gender, species, etc,
Ordinal : ordered categories; levels with a meaningful order
Examples: education level, grades, ranks
Factors in R
In R, factors are used to work with categorical variables
[1] "Adelie" "Chinstrap" "Gentoo"
See the forcatstidyverse)
Summarizing 1D categorical data
Setup: a single column of categorical data (i.e., 1D categorical data)
Frequency tables (counts) are the most common form of non-graphical EDA
Adelie Chinstrap Gentoo
152 68 124
prop.table (table (penguins$ species))
Adelie Chinstrap Gentoo
0.4418605 0.1976744 0.3604651
Visualizing 1D categorical data: Area plots
Each area corresponds to one categorical level
Area is proportional to counts/frequencies/percentages
Differences between areas correspond to differences between counts/frequencies/percentages
Bar charts
Create a bar chart with geom_bar()
library (tidyverse)theme_set (theme_light ())
|> ggplot (aes (x = species)) + geom_bar ()
Behind the scenes of geom_bar()
Flip your bar charts!
Just simply replace x with y (Quang prefers this way)
|> ggplot (aes (y = species)) + geom_bar ()
Or use coord_flip()
|> ggplot (aes (x = species)) + geom_bar () + coord_flip ()
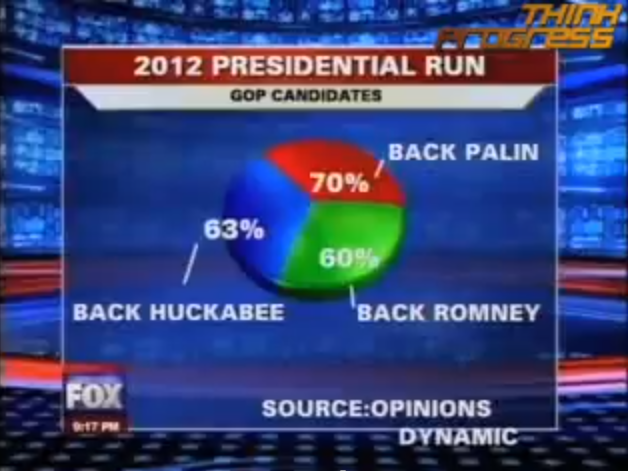
Crimes against bar charts
Crimes against bar charts
Statistical inference for 1D categorical data
Chi-squared test for 1D categorical data
Null hypothesis (\(H_0\) ): all categories have equal proportions (i.e., \(p_\texttt{Adelie} = p_\texttt{Chinstrap} = p_\texttt{Gentoo}\) )
chisq.test (table (penguins$ species))
Chi-squared test for given probabilities
data: table(penguins$species)
X-squared = 31.907, df = 2, p-value = 1.179e-07
Since \(p\) -value \(< 0.05\) (or any other reasonable significance level), we reject the null hypothesis at \(\alpha = 0.05\)
We have strong evidence that the proportions of penguins across all species are not the same
Spine charts
A single bar, with height/width divided into different categories
Height is proportional to counts (proportions)
|> ggplot (aes (fill = species, x = "" )) + geom_bar ()
Width is proportional to counts (proportions)
|> ggplot (aes (fill = species, y = "" )) + geom_bar ()
Pie charts
Circle is divided up into (pie) slices
One slice for each category
\(\text{Area}_{\text{ total}}= \pi r^2\)
\(\displaystyle \text{Area}_{\text{ slice}}= \frac{\pi r^2 \theta}{360^\circ}\)
Angle \(\theta\) is proportional is counts (proportions)
What about radius?
|> ggplot (aes (fill = species, x = "" )) + geom_bar () + coord_polar (theta = "y" )
Ugh…
:)
Rose diagrams
Circle sections for each category (like pie charts)
All sections (“petals”) have the same width/arc/angle
Radius of each section is proportional to category frequency
Made popular by Florence Nightingale
|> ggplot (aes (x = species)) + geom_bar (fill = "midnightblue" ) + coord_polar ()
Tips for visualizing 1D categorical data
You should pretty much always just make a bar chart
Spine charts will be more useful with more variables
Only use circular plots if circular/temporal context has actual meaning
Waffle charts are cooler anyway…
# install.packages("remotes") # remotes::install_github("hrbrmstr/waffle") library (waffle)|> count (species) |> ggplot (aes (fill = species, values = n)) + geom_waffle (n_rows = 20 , color = "white" ) + coord_equal () + theme_void ()